


Direct answer: There is no single "Malaysian SaaS landing-page conversion rate", and any article that gives you one number is misleading you. What actually works is (1) using credible international benchmark ranges — with source, definition, and date — to sanity-check your reality; (2) establishing your own baseline with enough sample to be trustworthy; and (3) diagnosing your funnel and prioritising experiments from there. This guide gives you the ranges, the baseline method, and the decision tools to plan honestly.
Key takeaways
- Benchmarks are useful as ranges with context, not as targets. Industry, traffic source, intent, device, and conversion definition each shift the number more than "country" does.
- Your own baseline — measured over a stable 4–8 weeks — is worth more than any external median.
- Sample size matters. A/B tests declared at n=200 are noise, not evidence.
- Malaysian context adjusts how you plan the funnel (mobile share, WhatsApp handoff, bilingual copy, payment trust), not the underlying benchmark ranges.
- The reporting template at the bottom is what your team should actually publish weekly.
Why one benchmark number is misleading
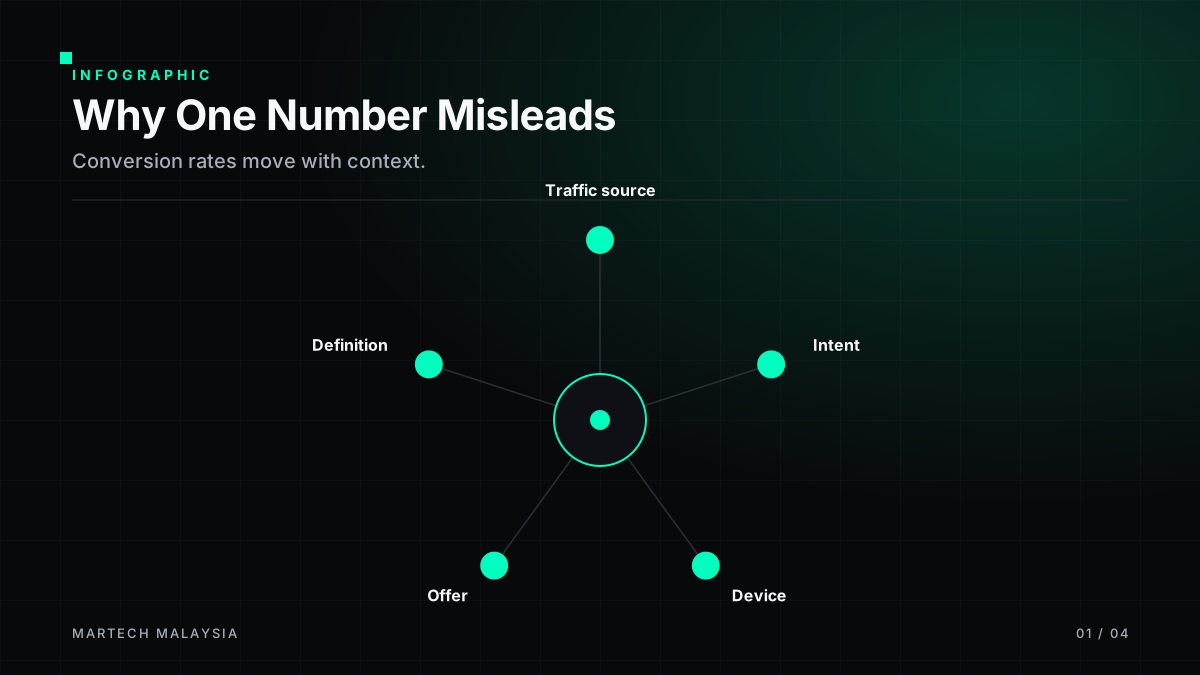
A "landing page converts at 2.35%" headline hides five decisions the author already made — what counts as a conversion, which traffic source, what device mix, what industry, what timeframe. Change any one and the number moves by a factor of two to five. The Unbounce Conversion Benchmark Report and WordStream's search advertising benchmarks both spell this out: medians are useful for orientation, dangerous as targets.
Segmentation dimensions that actually matter
| Dimension | Why it moves the number | Planning implication |
|---|---|---|
| Traffic source | Branded search converts many times higher than cold paid social | Report separately; never blend |
| Intent / stage of awareness | Bottom-of-funnel search intent converts more than top-of-funnel display | Segment by campaign type, not just channel |
| Device | Desktop typically converts higher on B2B; mobile dominates volume | Split desktop / mobile / in-app browser |
| Offer / commitment level | Free trial ≠ demo request ≠ purchase | Define one primary conversion, one guardrail |
| Conversion definition | "Signed up" vs. "verified email" vs. "activated" | Pick the closest event to revenue you can measure reliably |
Benchmark ranges with context
Use these as sanity checks, not targets. Every range below carries the source, definition, and reporting date so you can decide whether it applies to your context.
| Segment | Illustrative range | Source (retrieved 17 Jul 2026) | Definition / caveat |
|---|---|---|---|
| SaaS landing pages, median | ~3–6% (median, all industries) | Unbounce Conversion Benchmark Report | Any lead/action captured on the page; heavy right-skew — top decile is many times the median |
| B2B search ads, landing page CVR | Varies widely by industry; consult latest report | WordStream benchmarks | Google Ads only; excludes brand traffic; older data points still widely republished — check date |
| Free trial signup → paid | Reported ranges commonly ~15–25% self-serve; enterprise higher with human touch | Multiple vendor blogs — treat as directional only | Depends heavily on activation gates and pricing model |
| Form conversion — 1 field vs 5+ fields | Fewer fields correlates with higher completion | Baymard Institute research on form fields | Effect strongest on mobile; not a substitute for qualification |
| Malaysian mobile share of web traffic | Majority mobile in most consumer segments | StatCounter Malaysia platform share | Directional; B2B skews more desktop than consumer |
All specific rates above are illustrative unless the linked source is checked on the date you plan. Do not paste them into a slide without re-verifying.
Establishing your own baseline
- Freeze the page. No copy changes, no traffic mix changes for the baseline window.
- Choose a window. Four to eight weeks, covering at least two full business cycles. Exclude anomalies (launch, campaign spike, outage).
- Segment before averaging. Compute rates per traffic source × device × campaign. Only average within a segment, never across.
- Publish the definition. "Signup verified within 24h" is a definition. "Conversion" is not.
- Report uncertainty. Show the count, not just the rate. 40/2,000 is not 2%; it is 2% ± meaningful noise.
Sample size and uncertainty — the short version
Two intuitions save most teams from bad calls:
- Rates measured on fewer than a few hundred conversions per variant should be treated as directional only, not decisive.
- The smaller the baseline rate, the more traffic you need to detect a given uplift. A 1% baseline chasing a "20% relative lift" needs vastly more traffic than a 20% baseline chasing the same lift.
Use a proper calculator — Evan Miller's sample-size calculator is the standard reference — before you start a test, not after you look at results.
Funnel diagnostics — what to look at first
Top of funnel
Ad-to-page bounce, message-match audit, Core Web Vitals at the 75th percentile. If p75 LCP > 2.5s on mobile you are losing revenue before the visitor reads anything.
Hero interaction
Scroll depth to first proof block; CTA visibility on 390px viewport; time-to-first-click. Session replay reveals more than heatmaps for low-volume pages.
Form / commitment
Field-level drop-off, error rates, resubmit attempts. Baymard's form-fields research is a fair starting reference.
Post-submit
Verified vs unverified signups, hand-off latency to sales, WhatsApp reply time. In Malaysia the WhatsApp handoff often decides the deal, not the landing page itself.
Experiment prioritisation
Use a simple ICE (Impact, Confidence, Ease) or PXL-style score. Prioritise experiments that (a) touch a step with real drop-off, (b) have a plausible mechanism, and (c) can reach a decisive sample within a month at current traffic. Anything that fails one of those three is a distraction dressed as a test.
Decision rule: If a proposed test cannot reach ~200–400 conversions per variant within four weeks at current traffic, do not A/B test it — ship the change on judgment, or find a cheaper diagnostic (session replay, five-user usability, message-match audit) first.
Malaysian local adjustments
- Mobile-first is not optional. Design the 390px viewport before desktop; verify LCP on a mid-tier Android on 4G.
- WhatsApp handoff. A "Chat with us on WhatsApp" secondary CTA often outperforms an email form for SME buyers. Instrument it — the conversation is where the deal moves.
- Bilingual copy. Consider BM for consumer and SME operator audiences; English-first is usually fine for technical B2B. Do not machine-translate a hero.
- Payment and trust. Show FPX, e-wallet, and card logos where relevant. For B2B, show PDPA posture and data residency; procurement checks both.
- Currency and tax. Price in MYR by default, disclose SST inclusive/exclusive, and match the region of the visiting IP where possible.
Weekly reporting template
| Metric | Definition | Segment | Baseline | This week | Notes |
|---|---|---|---|---|---|
| Primary conversion rate | Verified signup / unique visitor | Paid search — mobile | [fill] | [fill] | One primary metric only |
| Guardrail | Trial → paid at 30 days | All self-serve | [fill] | [fill] | Downstream truth |
| Traffic quality | Bounce rate | By source | [fill] | [fill] | Diagnose, don't optimise |
| Speed | p75 LCP mobile | Full page | ≤ 2.5s | [fill] | From CrUX / RUM |
| Form completion | Submit / start | Primary form | [fill] | [fill] | Watch field-level drop-off |
Common pitfalls
- Comparing to a global median without context. If your channel mix or audience is different, the median is not your benchmark.
- Declaring winners on tiny samples. Statistical significance calculators mis-used are the largest source of wasted quarters we see.
- Optimising the page while the ad is broken. Message-match issues masquerade as landing-page problems.
- Ignoring downstream truth. A landing page that lifts signups but drops paid conversion is a regression.
- Fabricated local statistics. "Malaysian SaaS averages" pulled out of thin air survive the first meeting and die in the second. Cite ranges honestly.
Related reading
- Web app landing page examples (Malaysia) — patterns organised by job-to-be-done.
- Hero section patterns for web apps — cluster companion.
- PDPA-compliant landing page forms — trust and consent design.
- Web app landing page service — engaged support.
FAQs
What is a "good" landing page conversion rate in Malaysia?
There isn't one. The credible answer is a segmented range for your traffic source, device, and offer, sanity-checked against international benchmark ranges from named reports. If a consultant gives you a single Malaysia number without segments, treat it as marketing material, not evidence.
How long should I baseline before running experiments?
Four to eight weeks in most cases, spanning at least two business cycles. Longer if traffic is low or seasonal; shorter is rarely reliable.
Is a lower conversion rate always bad?
No. A page that filters out unqualified traffic will show a lower top-line conversion rate and better downstream numbers. Optimise for the metric closest to revenue you can measure reliably, not the vanity rate at the top.
Should I A/B test my landing page changes?
Only when you have enough traffic to reach a decisive sample within a reasonable window. Below that, ship on judgment and use qualitative diagnostics (session replay, usability testing, message-match audits) instead of underpowered tests.
How does WhatsApp change the funnel?
In Malaysia, a well-instrumented WhatsApp handoff often carries the deal further than the form does. Treat it as part of the funnel: measure reply time, first-message conversion, and drop-off between conversations.
Sources and further reading
All sources retrieved 17 July 2026.
- Unbounce. Conversion Benchmark Report.
- WordStream. Google Ads conversion rate benchmarks.
- Baymard Institute. Form-fields research.
- Google. Core Web Vitals. web.dev.
- Miller, E. A/B test sample-size calculator.
- StatCounter. Platform market share — Malaysia.
- Personal Data Protection Department, Malaysia. Official portal.
Frequently asked questions
What is a "good" landing page conversion rate?
There is no universal benchmark that applies cleanly to Malaysian SaaS. Rates vary widely by traffic source, offer type and audience intent. Your own trended baseline is more useful than any published figure.
How much traffic do I need to test?
Enough for statistical significance at your baseline conversion rate and target lift — usually thousands of sessions per variant. Use a sample-size calculator before you start.
Should I optimise mobile or desktop first?
Follow the traffic. Most Malaysian B2C traffic is mobile-dominant; some niche B2B remains desktop-heavy. Segment your data before deciding.